In this section we’re going to run the system we created in Lesson 2, and view its output in the Signal Results Grid.
Running Lesson2.sig to generate data
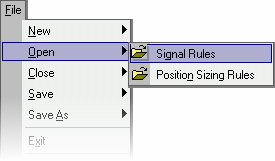
| 1 | Press Alt–F, and select Lesson2.sig from the recently used file list (bottom of the File menu. If it doesn’t appear there, press O to select Open, Signal Rules (File menu), and open from ..\Mechanica\Sample Rules\Signal Rules. |
| 2 | Try it both ways yourself, so it doesn’t become a source of confusion later on. By the way, Word and Excel behave in precisely the same manner. |
| 3 | Comment out the two Mechanica Basic statements that were added to detect the presence of crossed signals, at the bottom of the Resources page. The Resources page of Lesson2.sig should now look like this: |
![]()
SYSTEM = 1
COL1 = CLOSE
COL2 = SMA[CLOSE,28] 'barometer of trend
COL3 = MIN[LOW,10,0] 'long exit price
COL4 = MAX[HIGH,10,0] 'short exit price
'detects long exit signal above 28-day SMA
'IF COL3[1] > COL2[1] THEN BEEP ; COL5 = 1
'detects short exit signal below 28-day SMA
'IF COL4[1] < COL2[1] THEN BEEP ; COL5 = -1
| 4 | From the Data menu, choose Symbol Manager. |
| 5 | Make sure that the Pinnacle_Futures Data Page is still selected (checked). Tag it (check it) if it is not, and untag any other Data Pages that are currently tagged. |
| 6 | Under the Tag Symbols tab, make sure that the second British Pound symbol (BP_B_REV) is still tagged. Tag it if it is not, and untag any other Symbols that may be currently tagged. |
| 7 | Close the Symbol Manager. (The items you tag and the data you enter are written to disk immediately.) |
| 8 | From the Signals menu, choose Run Signal Rules to run the system. Alternately, click on the Run Signal Rules icon on the Signal toolbar: |
![]()
|
When running Signal Rules on multiple symbols, Mechanica processes them in alphabetical order. At the conclusion of the run the Grid displays data for the last symbol processed. |
As stated in the introduction to this section, the Grid is designed to allow you to quickly visualize a market position in the context of its associated data, to aid in verifying that your system is entering and exiting trades as intended. It also facilitates the fast troubleshooting of other issues, as they arise.
Notice that when the Signal Rules run is complete, the Results Window takes focus. All the column definitions (assignments) in Lesson2.sig are now available for viewing in the Signal Results Grid:
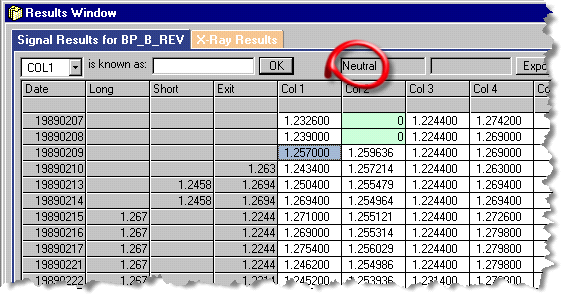
| n | The Signal Results tab (top left), doubles as a status bar and displays the file name of the symbol (instrument) whose data you are viewing. In this case, BP_B_REV (Pinnacle Data’s British Pound). |
| n | When the Signal Rules run is complete, the default active cell will be the first trading day after all the indicators have completed their calculations; in this case 19890209. Notice that Column 2 (the 28-day simple moving average), is still displaying zeros prior to this date (highlighted, above); this means it is still gathering the data needed for the computation of its first data point. |
| n | The Position Status field (circled, top) displays Neutral, indicating that the system is now flat (not in a trade). |
| n | After all the indicators have come up to speed, Mechanica processes one more day of data. Thus, the first date eligible for trade entry occurs one day after the indicator with the longest look back (Col 2), completes its calculations. In this example, first date eligible for trade entry is 19890210. |
| n | The leftmost column of the Grid displays the date. Thus, each row represents one trading day and all its associated data. |
| n | The next three columns display the Long and Short entry prices, and their corresponding Exit price(s). |
| n | Columns 1 - N in the Grid display the values of the column definitions contained in your SIG file. |
| • | Press DOWN ARROW once, so that the active cell aligns with the date 19890210, and note that the Position Status field changes from Neutral to Wrong Side (image not shown: view on your desktop.) |
| • | Press DOWN ARROW again; and note that the Position Status field now displays Short, meaning that the system entered into a short trade on this date (19890213): |
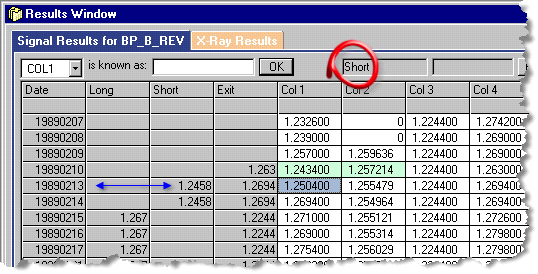
| n | The validity of the short entry on 19890213 can be easily verified by looking at the relevant Column values. Remember our entry rules for a short trade: |
IF CLOSE[1] < COL2[1] THEN SELLOPEN 'short entry sig.
Yesterday, 19890210, the close of 1.243400 (shown highlighted in Col 1), is indeed lower than the yesterday’s value in Col 2 of 1.257214 (also highlighted). Thus, a short entry was indicated for 19890213, and the system went short that day at the price of 1.2458, shown in the “Short” column.
| • | Press DOWN ARROW once more, so that the active cell aligns with 19890214 (shown below). |
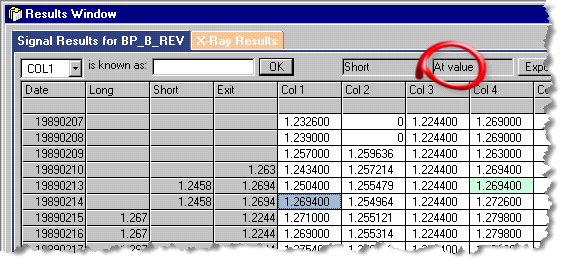
| n | Remember the rule for exiting (covering) short trades: BUYSTOP = COL4[1]. |
| n | Notice when you arrowed down to the date 19890214, that the Exit Status field, red circled above (not the Exit column), displays data for the first time; At value means that the exit price was hit or exceeded on that date, and the trade exited at the Buystop value of 1.269400, highlighted in Col 4, the previous day. (Don’t be confused by the fact that exit price happens to correspond with the close for the same day, shown in Col1. It is purely coincidental.) |
| n | Although this first trade only spans two days, the exit day also happens to be a signal day for a trade in the long direction, which was entered the next trading day. This is evident from the data displayed in the “Long” column for the date 19890215, which shows the entry price for this new trade of 1.267 (see blue highlighted cell in Col1, the previous trading day), along with its current exit price of 1.2244, which is the value in Col 3, yesterday, to be precise (since all values of Col3 during this time period have the same value). |
| • | Press DOWN ARROW once more, to 19890215, and you will see the Position Status change from Short to Long. |
Clearly, tracing entries and exits in the Grid would be a lot easier if we didn’t have to keep referring back to the SIG file. In fact, it’s not necessary at all! That’s what grid column aliases are all about. They allow you to assign descriptive, plain English labels to the column headings in the Grid, so that referring back to the SIG file is no longer necessary, and...you can reference them directly in your code.
We’ll explore grid column aliases in just a minute. But first, we’ll discuss the Position Status and Exit Status fields in more detail.