Operational overview
The Grid display in the Results Window aids in system development by allowing you to quickly visualize a market position in the context of its associated data and view indicator values and custom formulas to quickly verify that your system is entering and exiting trades as intended.
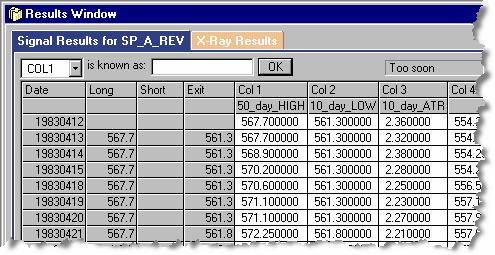
| n | The Signal Results tab displays the symbol (instrument) whose data is displayed in the Grid. In this case, the symbol is SP_A_REV (which is Pinnacle Data’s nomenclature for the “reversed,” or back-adjusted S&P 500 stock index future). |
| n | The leftmost column of the Grid displays the date; each row represents one trading day. |
| n | We can see from the Grid that the system was flat on April 12, 1983 (the first date shown). The second column from the left, “Long,” shows the price at which the system entered a long trade (the next day), on April 13, 1983. Since the system is now long, the “Short” column is empty. The fourth column shows the exit price specified in your code. |
| n | Columns 1 - N in the Grid display values that are assigned to the column definitions in your system. |
|
The Grid is populated with fresh data every time the Signal Rules are run. |
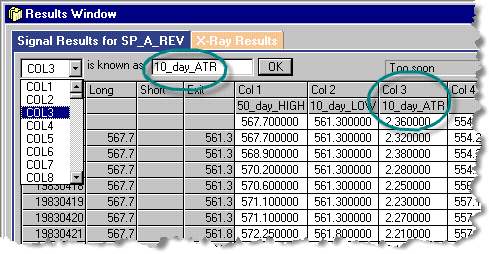
| n | In the image above, immediately under each of the column numbers, appears a grid-column alias. (The alias for Col 3 is “10_day_ATR” ...circled, top-right). |
| n | Aliases are descriptive labels you create, that are associated with a grid-column. They can help you organize your thoughts, make trade tracing and troubleshooting easier, and make your code clearer and easier to read. |
| n | To create an alias, simply select a column number from the drop-down list box, and enter the desired alias in the edit text box (circled top, left of center). Then press OK, and the alias will appear under the Col N heading. (No need to do this now. We’ll go through it step-by-step again in a moment.) |
| n | Grid-column aliases are automatically declared as variables upon creation, and can (then) be used in your system code. |
Example
For the system whose data is shown in the Grid image above, the raw Column 1 definition (assignment) on the Resources page looks like this:
COL1 = MAX[H,50,0]
Then, on the Trade Entry page (in this example), you can either reference Column 1 directly:
IF CLOSE[1] > COL1[1] THEN BUYOPEN
...or you can reference Col 1’s grid-column alias:
IF CLOSE[1] > 50_day_HIGH[1] THEN BUYOPEN
The two statements are functionally and logically equivalent.