To reiterate: Mechanica is today-centric in its time orientation. You always trade today, based on something that happened in the past, usually something that happened yesterday.
Therefore, with regard to keywords whose syntax contains a day offset, such as, MIN and MAX, we strongly recommended that you keep the day offset equal to zero when these keywords are used on the Resources page, and employ the requisite day offset in all entry and exit statements (as you would with any other such keyword). Employing day offsets in this manner keeps you from inadvertently introducing postdictive errors into your system code.
Please open Lesson4.sig. It employs a channel breakout to signal trade entry, and subsequently enters on a stop price, plus or minus a tick. (Exits are added simply to make the system functional, if you should choose to run it.)
The system is run on JY_REV. The recommended day offsets are shown.
Resources
SYSTEM = 1
COL1 = MAX[HIGH,34,0] 'long entry price
COL2 = MIN[LOW,34,0] 'short entry price
COL3 = SMA[CLOSE,34] 'exit indic. (long and short)
Trade Entry
BUYSTOP = COL1[1] + TICK[1] 'long entry signal
SELLSTOP = COL2[1] - TICK[1] 'short entry signal
Trade in Progress & Exit
IF C[1] < COL3[1] THEN SELLOPEN 'long exit signal
IF C[1] > COL3[1] THEN BUYOPEN 'short exit signal
Implications for charting
The system enters long when price today breaks out (is one tick higher) than the channel breakout indicator (Col1).
The system enters short when price today breaks out (is one tick lower) than the channel breakout indicator (Col2).
However, an issue arises when viewing the output on a trade chart (choose Signal Chart, under the Signals menu).
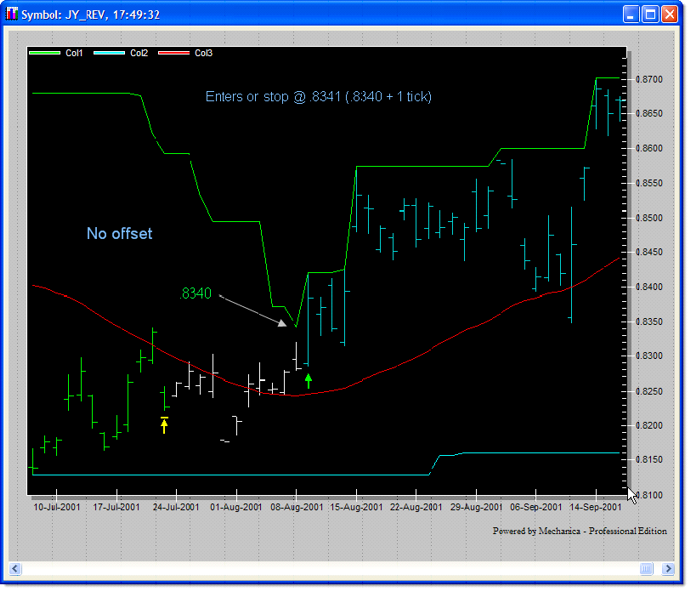
The trade enters long on 20010809 at the price of .8341, which is one tick higher than the previous trading day’s value of Col1, which is .8340.
Although in this example it’s easy to see why the trade entered on the bar it did, and at approximately what price it entered, at other times the situation may be visually less clear .
Remember:
COL1 = MAX[HIGH,34,0]
Thus, each time a price today exceeds the highest price of the past 34 days, the channel breakout indicator literally tracks each new higher price (this is easily seen in the first example), yet with a zero day offset, price never crosses it.
Forcing a one-day offset
It’s often easier to visualize what happened, and why, when the indicator intersects the bar at, or near the entry price.
The way to accomplish this is to make a set of column assignments that offsets all the columns whose values you wish to display on a chart, by a day, as shown in Col4 through Col6 below. (Un-comment these lines in Lesson4.sig, if you are following along in Mechanica.)
Resources
SYSTEM = 1
COL1 = MAX[HIGH,34,0] 'long entry price
COL2 = MIN[LOW,34,0] 'short entry price
COL3 = SMA[CLOSE,34] 'exit indic. (long and short)
'
COL4 = COL1[1] 'one day offset for charting
COL5 = COL2[1] 'one day offset for charting
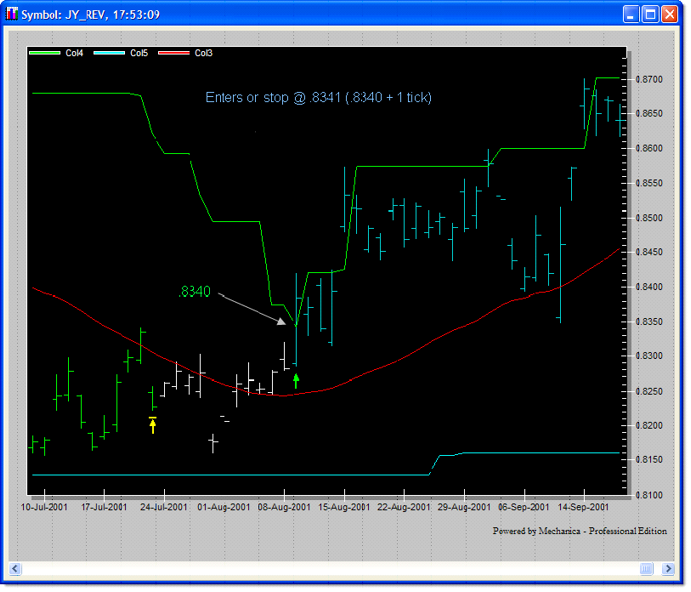
Now that the indicators are displayed with a one-day offset, note how much easier it is to visually connect the day of entry with the indicator that triggered it.
Also note that displaying yesterday’s value today, has the effect of moving the indicator forward in time.
Please open Lesson4a.sig. The indicators on the Resources page remain the same (a channel breakout is still used to signal trade entry).
But in this incarnation, the system goes long on the open today following a breakout by yesterday’s close. This means that yesterday’s price must close higher than the previous day’s channel value (the value of Col1).
All of a sudden we’re juggling a lot of days. Let’s break it down, for a theoretical trade in the long direction:
• Mon PM |
Col1 = X |
• Tue PM |
Price closes higher than X (a “breakout” occurs) |
• Wed AM |
Enter on the open (BUYOPEN) |
So in order to buy on the open today, following a breakout yesterday, we have to look back two days from today, instead of one.
This is shown on the Trade Entry page, below:
Resources
SYSTEM = 1
COL1 = MAX[HIGH,34,0] 'long entry price
COL2 = MIN[LOW,34,0] 'short entry price
COL3 = SMA[CLOSE,34] 'exit indic. (long and short)
'
COL4 = COL1[1] 'day offset for charting
COL5 = COL2[1] 'day offset for charting
Trade Entry
IF C[1] > COL1[2] THEN BUYOPEN 'long entry signal
IF C[1] < COL2[2] THEN SELLOPEN 'short entry signal
Trade in Progress & Exit
IF C[1] < COL3[1] THEN SELLOPEN 'long exit signal
IF C[1] > COL3[1] THEN BUYOPEN 'short exit signal
Implications for charting
We’ve retained the day offset on the Resources page for charting purposes; now, when viewing the trade chart (Chart below), it is clear that the long entry today followed a price breakout by yesterday’s close. It is less obvious, however, without the benefit of the day offsets at the bottom of the Resources page.
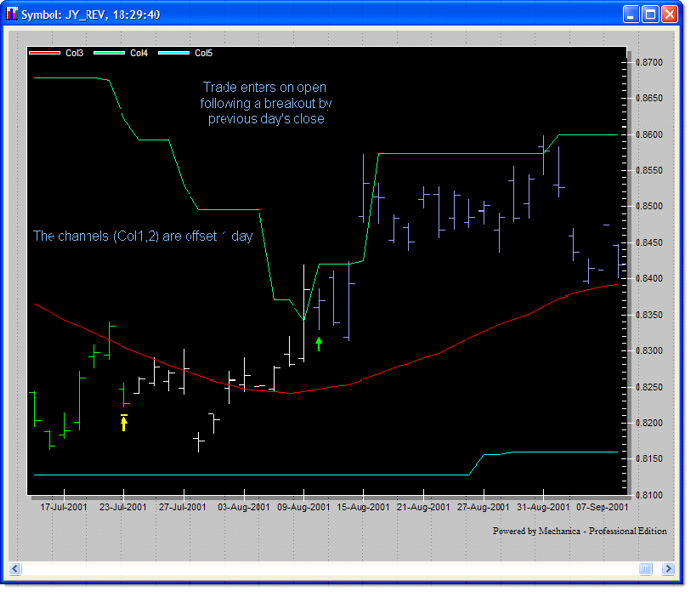
If the concept is still unclear at this point, it is a worthwhile exercise to go back and change the two-day offsets for the Column values on the Trade Entry page to one-day offsets, instead, and then trace down the logic behind…why no trades occur.
Simple Moving Average - enters on the open
Please open Lesson4b.sig.
This system trades the long side only. For a trade in the long direction, this system enters on the open today following a close above a simple moving average yesterday.
The correct offsets are shown for the entry logic.
Resources
SYSTEM = 1
COL1 = SMA[CLOSE,34] 'entry indicator
Trade Entry
IF C[1] > COL1[1] THEN BUYOPEN 'long entry signal
Trade in Progress & Exit
IF C[1] < COL1[1] THEN SELLOPEN 'long exit signal
Implications for charting
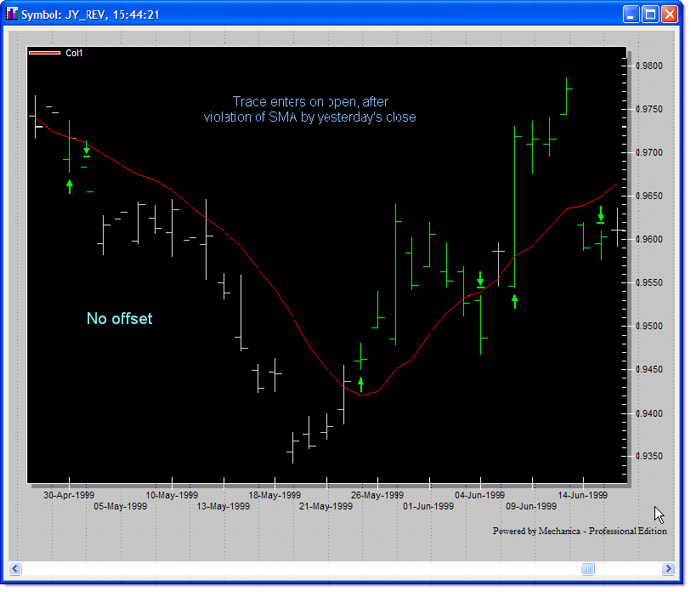
It is easy to see why our sample trade enters when it does; The previous day’s price closes above the SMA, signaling an entry today (19990525).
Note that the one-day offset(s) on the Resource page that are added in the previous exercises are absent here, yet the relationship of the indicator to the entry is visually clear.
Add the following code to the Resources page:
COL2 = COL1[1] 'one day offset for charting
Now run the system and look at the chart. Col1 is still plotted in red, Col2 appears in turquoise.
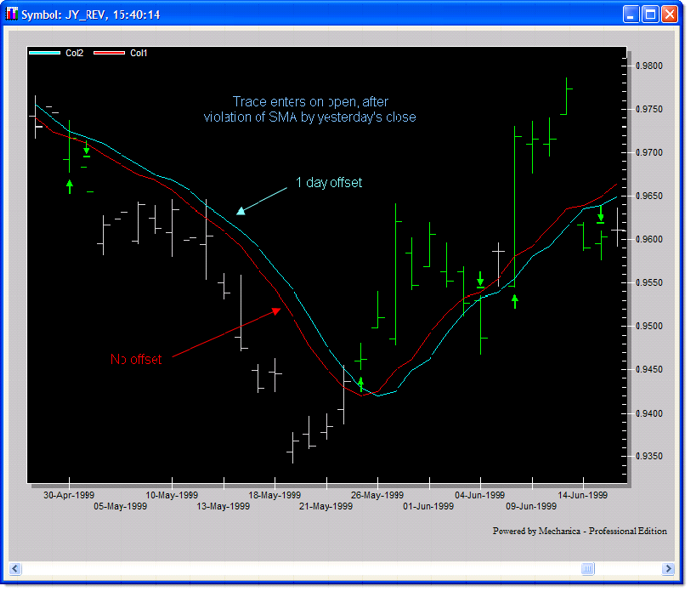
In this case, offsetting the SMA by a day actually confuses matters. If you enter on a stop, instead of on the open after a violation of the close the day before, adding the day offset to the SMA (on the Resources page) adds visual clarification.
Thus, the necessity of adding a day offset for charting purposes depends on the inidicator(s) used, and on the method of entry.