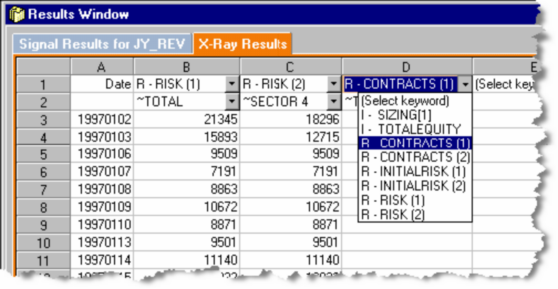
The following curves are generated when the Position Sizing Rules are run:
| Ø | Equity - Linear (scale) |
| Ø | Equity - Logarithmic (scale) |
| Ø | Total vs. Closed |
| Ø | Drawdown (%) |
| Ø | Risk |
Equity Charts, like most of the graphical elements in Mechanica, reside in tabbed windows, grouped by concept.
Synchronize Grid rows to chart bars with one click. Flexible bar charting with assignable colors, grids, and plots; Four charting panels, each with 4 custom plots.
Individual charts are generated for Daily, Monthly, Quarterly, Yearly and 12 Month Rolling Returns.
Individual charts display the following frequency distributions: Time in Drawdown, Drawdown Percentages, and Daily, Monthly, Quarterly Returns.
Comprehensive Monte Carlo Analysis, including:
Distribution Charts - display the frequency distributions of Worst Drawdowns, ROI, MAR, Final Equity, and Sharpe Ratio.
Data Comparison - displays a user-selectable comparison of any two of the following: Worst Drawdowns, ROI, MAR, Final Equity, and Sharpe Ratio.
Equity Curves - charts equity curves (on a linear scale) of outcomes, based on a user-selectable number of iterations and bars per iteration.
Portfolio Summary Report (PSR) contains all the statistics professional traders expect, including MAR, Sharpe Ratio, Sterling Ratio, Jack Schwager’s Return Retracement Ratio, and many more. PSR displays automatically when Position Sizing rules are run. Also provided is an array of detailed spreadsheet-style reporting at daily, monthly, quarterly, and annual resolutions. Includes a daily trade-by-trade summary and a sortable trade summary.
Inspect the spreadsheet-style Grid display during system development to quickly visualize a market position in the context of its associated data, such as indicator values, or custom formula values.
The Grid, located in the Signal Results window, is the tool to use when inspecting the details of your trade logic or debugging a complex system. One click is all it takes to visually link chart bars with Grid rows.
An extremely flexible tracing tool. Drill down into the multitude of equity and risk figures that influence your position sizing and resizing operations. View your portfolio in layers, through multiple (resizing) category windows.
